Table
The table shown below is all the water quality data for the Thompson Run Creek
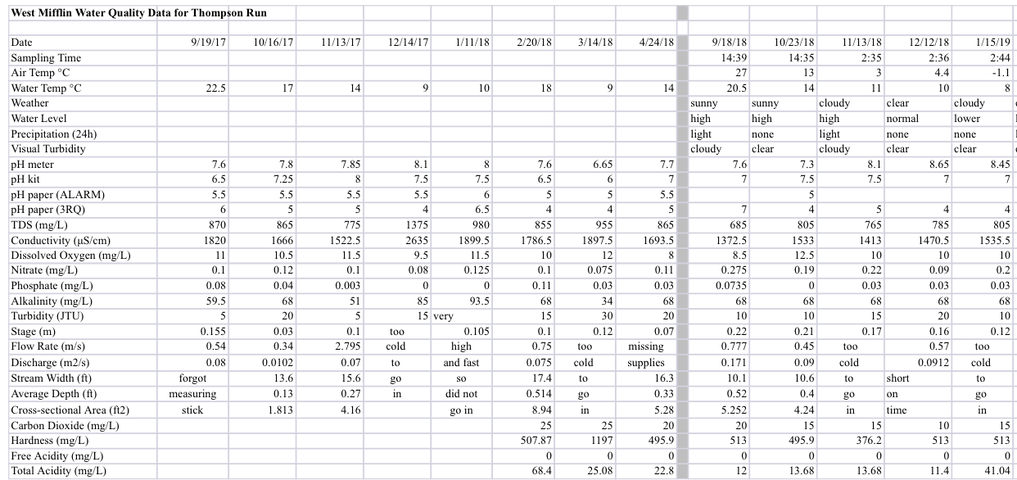
Someone out there is most likely asking where is the water quality data? Well it is right here shown above with everything you need to know the water quality of this creek. This table shows everything from the date this happened to the time, and even the flow rate of the water too! Our class as done many papers in class to test the water to see if certain chemicals are active. We have done this numerous times in class.
On the table is everything you need to answer questions about the creek. Any question you may have, this table can answer it. Below this text you can also find a chart on the water turbidy, past and present.
On the table is everything you need to answer questions about the creek. Any question you may have, this table can answer it. Below this text you can also find a chart on the water turbidy, past and present.
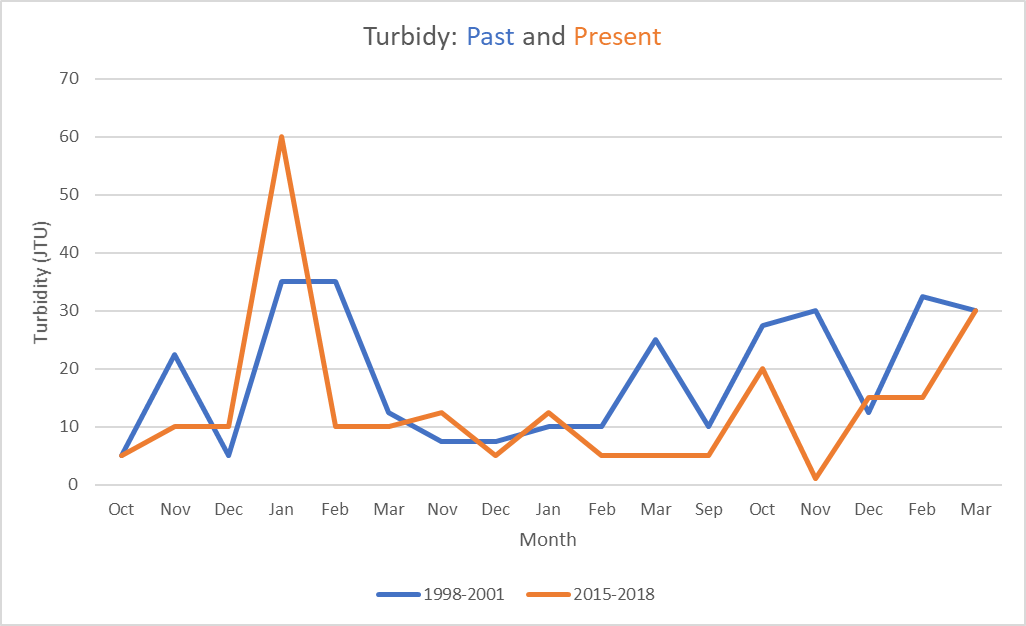
So, one question we could ask, that can be answered by the graph is how turbid was the water of the creek from October of 1998 to October of 2001?
